ComputePulse
Predictive GPU-Cluster Intelligence & Failure-Risk Forecasting
A predictive GPU-cluster intelligence prototype that combines telemetry monitoring, LightGBM risk scoring, explainable alert presentation, and an operational dashboard.
Application Interface & Live Telemetry
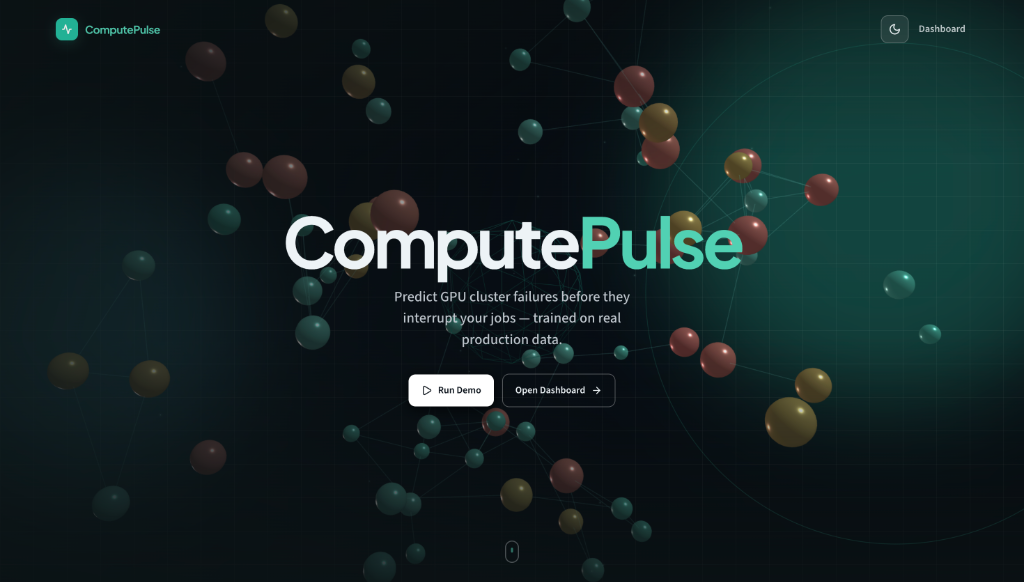
Genuine interface screenshot captured from the deployed ComputePulse codebase.
Problem & Context
GPU clusters operate under intense thermal and memory workloads. Identifying early warning signals of node stress before job crashes occur helps infrastructure teams prioritize maintenance.
Created during a competitive hackathon and subsequently organized into a clean prototype demonstrating how predictive models and explainability can aid hardware operations.
Role & Contributions
Team Lead & Backend/ML Developer. Led team coordination, built the FastAPI backend and simulated metric feeds, integrated the LightGBM risk estimator, and created the triage dashboard.
- Telemetry-driven GPU node health monitoring
- LightGBM-based risk model estimating node fault probability
- SHAP-based feature attribution for thermal and memory utilization anomalies
- Rule-based mitigation recommendations and alert triage UI
- Fully deployed demonstration web interface
Architecture & Engineering Decisions
A telemetry processing pipeline that ingests simulated GPU sensor metrics (temperature, memory utilization, fan speed, power draw) and computes anomaly risk scores with root-cause indicators.

Architecture Overview: ComputePulse multi-node telemetry stream, LightGBM fault risk scoring, and SHAP root-cause feature attribution.
- 1.Telemetry Simulation Service: Generates multi-node sensor streams across nominal and stressed operating profiles.
- 2.Anomaly Risk Estimator: LightGBM model estimating node failure likelihood based on rolling telemetry trends.
- 3.Attribution Layer: SHAP feature breakdown highlighting whether thermal creep, power spikes, or memory pressure drive the risk score.
- 4.Operator Dashboard: Interactive cluster node grid, time-series charts, and rule-based mitigation recommendations.
Decision Log & Trade-offs
Rationale: Decoupling the FastAPI analytics backend from the React visualization frontend allowed clean API contracts and independent development.
Trade-off: Required maintaining OpenAPI schemas across both services.
Rationale: Provides an immediate visual triage heuristic for operators before inspecting multi-sensor graphs.
Trade-off: Threshold boundaries require calibration depending on hardware tolerance.
Experimental Methodology & Evaluation
Tested against synthetic multi-node operational profiles simulating thermal stress patterns and memory load spikes.
Evaluation Metrics & Targets
Demonstrated automated risk scoring and visual feature attribution across simulated multi-node cluster configurations.
Implemented and Verified Capabilities
- Built and deployed a functional demonstration platform with live telemetry feeds.
- Demonstrated automated pre-failure alerts identifying simulated cooling unit stress before critical thermal thresholds.
- Recognized for end-to-end prototype completeness and clean interface design.
Limitations & Scope Constraints
Scientific Boundaries & Future Scope:
- •Validated on synthetic and simulated telemetry distributions rather than production NVIDIA DCGM enterprise cluster feeds.
- •Workload mitigation recommendations are rule-based advisory suggestions rather than executed orchestrations.