Healthcare Analytics Platform
Reproducible Risk Modeling & Explainable Decision Support
A research prototype exploring reproducible risk modeling, cross-validation protocols, and explainable decision support across public structured health datasets.
Application Interface & Live Telemetry
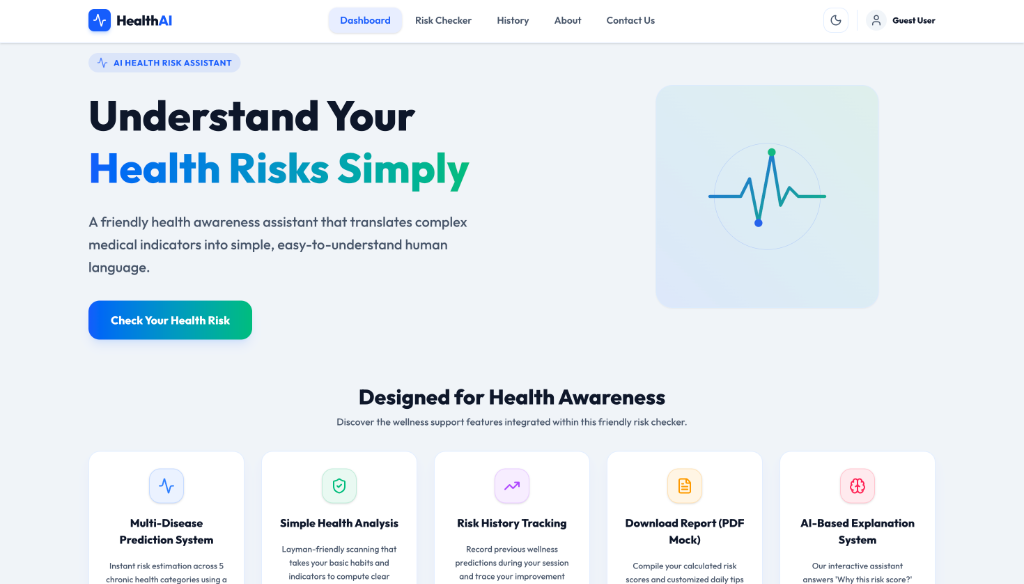
Genuine interface screenshot captured from the deployed Healthcare Analytics Platform codebase.
Problem & Context
Predictive healthcare demos frequently present optimistic metrics without proper validation or interpretability. Real health informatics workflows require transparent calibration, baseline comparisons, and clear disclosures of data boundaries.
Developed as part of academic research exploration in health informatics, focusing on responsible machine learning practices and explainability in structured clinical data analysis.
Role & Contributions
Lead Developer & Researcher. Built the data cleaning and preprocessing pipelines, implemented stratified cross-validation routines, trained baseline classifiers, and developed the web interface.
- Stratified cross-validation across structured biomarker datasets
- Model calibration and probability evaluation
- Feature-level risk attribution using SHAP summary plots
- Explicit documentation of dataset scope, limitations, and ethical boundaries
Architecture & Engineering Decisions
An analytical pipeline connecting structured tabular health records to calibrated classifiers and an explainable decision-support dashboard.

Architecture Overview: Healthcare Analytics data processing, in-fold cross-validation pipeline, and SHAP biomarker attribution breakdown.
- 1.Data Preprocessing: Handles missing value imputation and biomarker scaling strictly within cross-validation folds.
- 2.Model Benchmarks: Evaluates Logistic Regression, Random Forest, and Gradient Boosted trees under stratified cross-validation.
- 3.Calibration Assessment: Evaluates predicted probabilities to ensure reliable risk indicators.
- 4.Explainability Layer: SHAP feature importance plots showing relative biomarker contributions.
- 5.Exploration UI: Interactive scenario planner allowing inspection of risk score variations across biomarker profiles.
Decision Log & Trade-offs
Rationale: Framed all model outputs as statistical risk indicators rather than medical diagnoses, including prominent disclaimers regarding clinical validation boundaries.
Trade-off: Avoids sensational claims while maintaining scientific integrity.
Rationale: All scalers and imputers were fit strictly within cross-validation splits to prevent data leakage and overly optimistic evaluation.
Trade-off: Slightly increased training runtime during pipeline evaluation.
Experimental Methodology & Evaluation
Evaluated on public benchmark tabular health datasets (chronic kidney disease, cardiovascular indicators) using ROC-AUC, PR-AUC, and stratified cross-validation.
Evaluation Metrics & Targets
Demonstrated that calibrated models paired with feature attribution provide transparent insights into biomarker risk factors.
Implemented and Verified Capabilities
- Constructed a clean, reproducible healthcare analytics repository with documented data schemas.
- Implemented transparent SHAP visualizations explaining individual risk scores based on physiological indicators.
- Established an ethical and methodological foundation for healthcare machine learning experiments.
Limitations & Scope Constraints
Scientific Boundaries & Future Scope:
- •Trained and evaluated on public benchmark datasets; has not undergone clinical trial validation or electronic health record (EHR) integration.
- •Not intended or approved for clinical diagnostic use.